从0开始写多项式回归代码
代码文件夹sourcecode-cn
import numpy as np

x = np.array([1,4])
y = np.array([[2,3,4],[4,5,6]])
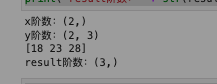
print("x阶数:" + str(x.shape))
print("y阶数:" + str(y.shape))
result = np.dot(x, y)
print(result)
print("result阶数:" + str(result.shape))
import numpy as np
import matplotlib.pyplot as plt

# 读入训练数据
train = np.loadtxt('click.csv', delimiter=',', dtype='int', skiprows=1)
train_x = train[:, 0]
train_y = train[:, 1]
# 标准化
mu = train_x.mean()
sigma = train_x.std()
def standardize(x):
    return (x - mu) / sigma

train_z = standardize(train_x)

# 参数初始化
theta = np.random.rand(3)
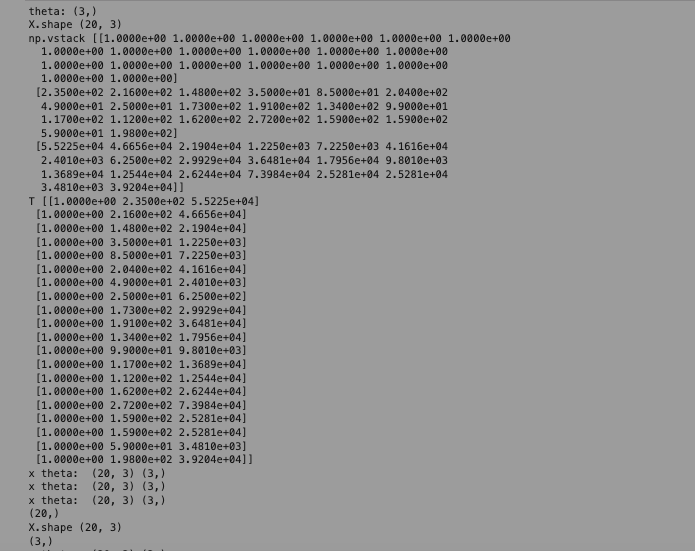
print('theta:', theta.shape)

# 创建训练数据的矩阵
def to_matrix(x):
    return np.vstack([np.ones(x.size), x, x**2]).T

X = to_matrix(train_z)
print('X.shape', X.shape) # (20, 3)
print('np.vstack', np.vstack([np.ones(train_x.size), train_x, train_x**2]))
print('T', np.vstack([np.ones(train_x.size), train_x, train_x**2]).T)
# print('np.ones', np.ones(train_x.size))

# 预测函数ds
def f(x):
    print('x theta: ', x.shape, theta.shape) # (20, 3), (3,)
    # [20x3]x[1x3]=[20x1] ??? 这里不理解
    return np.dot(x, theta)

# (20,)
# print('f(X).shape', f(X).shape)

# 目标函数
def E(x, y):
    return 0.5 * np.sum((y - f(x)) ** 2)

# 学习率
ETA = 1e-3

# 误差的差值
diff = 1

# 更新的次数
count = 0

# 直到误差的差值小于 0.01 为止,重复参数更新
error = E(X, train_y)
while diff > 1e-2:
    # 更新结果保存到临时变量
    # 这里奇怪,这里不太理解
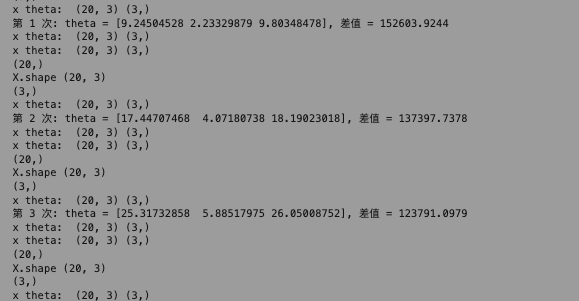
    theta = theta - ETA * np.dot(f(X) - train_y, X)
    # (20,) 意思是1行20列
    print((f(X) - train_y).shape)
    # (20, 3)
    print('X.shape', X.shape)
    print(theta.shape) # (3,)
    # print('f(X) - train_y:', f(X) - train_y)
    # print('X:', X)
    # print('np.dot(f(X) - train_y, X):', np.dot(f(X) - train_y, X))

    # 计算与上一次的误差值
    current_error = E(X, train_y)
    diff = error - current_error
    error = current_error

    # 输出日志
    count += 1
    log = '第 {} 次: theta = {}, 差值 = {:.4f}'
    print(log.format(count, theta, diff))

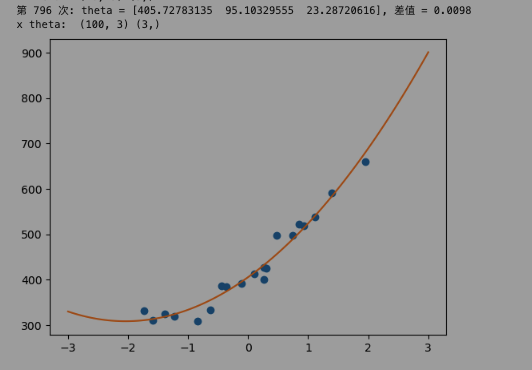
# 绘图确认
x = np.linspace(-3, 3, 100)
plt.plot(train_z, train_y, 'o')
plt.plot(x, f(to_matrix(x)))
plt.show()